A Guide To Pyqgis 3 Aka How To Help Yourself: Part 2 A Plan Of Attack
This is the 2nd part of a multi-part blog post that I’ll continue to write about: How to help yourself using Python for QGIS 3 (PyQGIS 3). In the first part I focused on basics and background information such as:
-Where to find documentation -How to interpret the documentation -tips and tricks of getting more help -using the docs vs help in the QGIS python console
I will be applying these tactics in this post and following posts, showing examples of real world QGIS tools and workflows. I was inspired to write these posts through my own frustrations in orienting myself to using Python with QGIS. While I think the QGIS development team has done a great job in providing an open source alternative to ESRI/ArcGIS, naturally there will be gaps in documentation and so on as QGIS is a community effort, primarily relying on volunteers. I’m writing these posts for several reasons. First, I write them for myself as a way to attempt to better understand the solutions I figure out and capture my frame of mind while I’m still current in the project. I assume I’ll have similar issues in the future so hopefully I can do my future self a favor and document the process as I go. Second, I think that if I am having these problems, other QGIS users are too. Maybe I can save someone else some effort? Initially I thought no one would ever read my posts except me but I have actually received so feedback from the community. So I know I am not alone.
Before we begin, two different code solutions are available at the end of this blog post, for your reference.
Now lets use an example which I will really pull apart and examine each step of the process. This is meant to be a workflow example. The subject matter is secondary, but you’ll see in detail how I write my code by navigating the documentation and using other tools to my advantage (like the QGIS console) and unfortunately this is a bit tedious. Even if you are not interested in the functionality, I hope you’ll be able to take away my process and adapt it to your own preferences.
In this post I am going to build on little bits of code I used in my previous blog post. This subject of this post will be: How to make a plan of attack or How to address a PyQGIS issue. My workflow usually goes something like this:
-Identify problem -Google it (ie: “Raster Calculator PyQGIS”) -This usually leads me to a StackOverflow thread or QGIS documentation -Use someone else’s code example, or as I build in experience, maybe adapt code from my own knowledge repository -Look at PyQGIS classes documentation usually in Python and maybe also in C++ -The usual coding process of trying, failing, re-writing, trying again -If I am really stumped, ask a question on StackOverflow
Now for my process… A while back I asked a question on StackOverflow. I was working with a Raster layer and I wanted to access the pixel values in that layer.
Here is the code I started with when I asked the question:
layer = iface.activeLayer()
print("Active Layer: ", layer.name())
provider = layer.dataProvider()
extent = layer.extent()
stats = provider.bandStatistics(1, QgsRasterBandStats.All)
I know how to do this in QGIS using various widgets. For a given raster layer, right click and go to “properties” > “symbology”. Here, I can manually access the various pixel values in that raster layer. Here is a screenshot of what this looks like via the “symbology” tab:
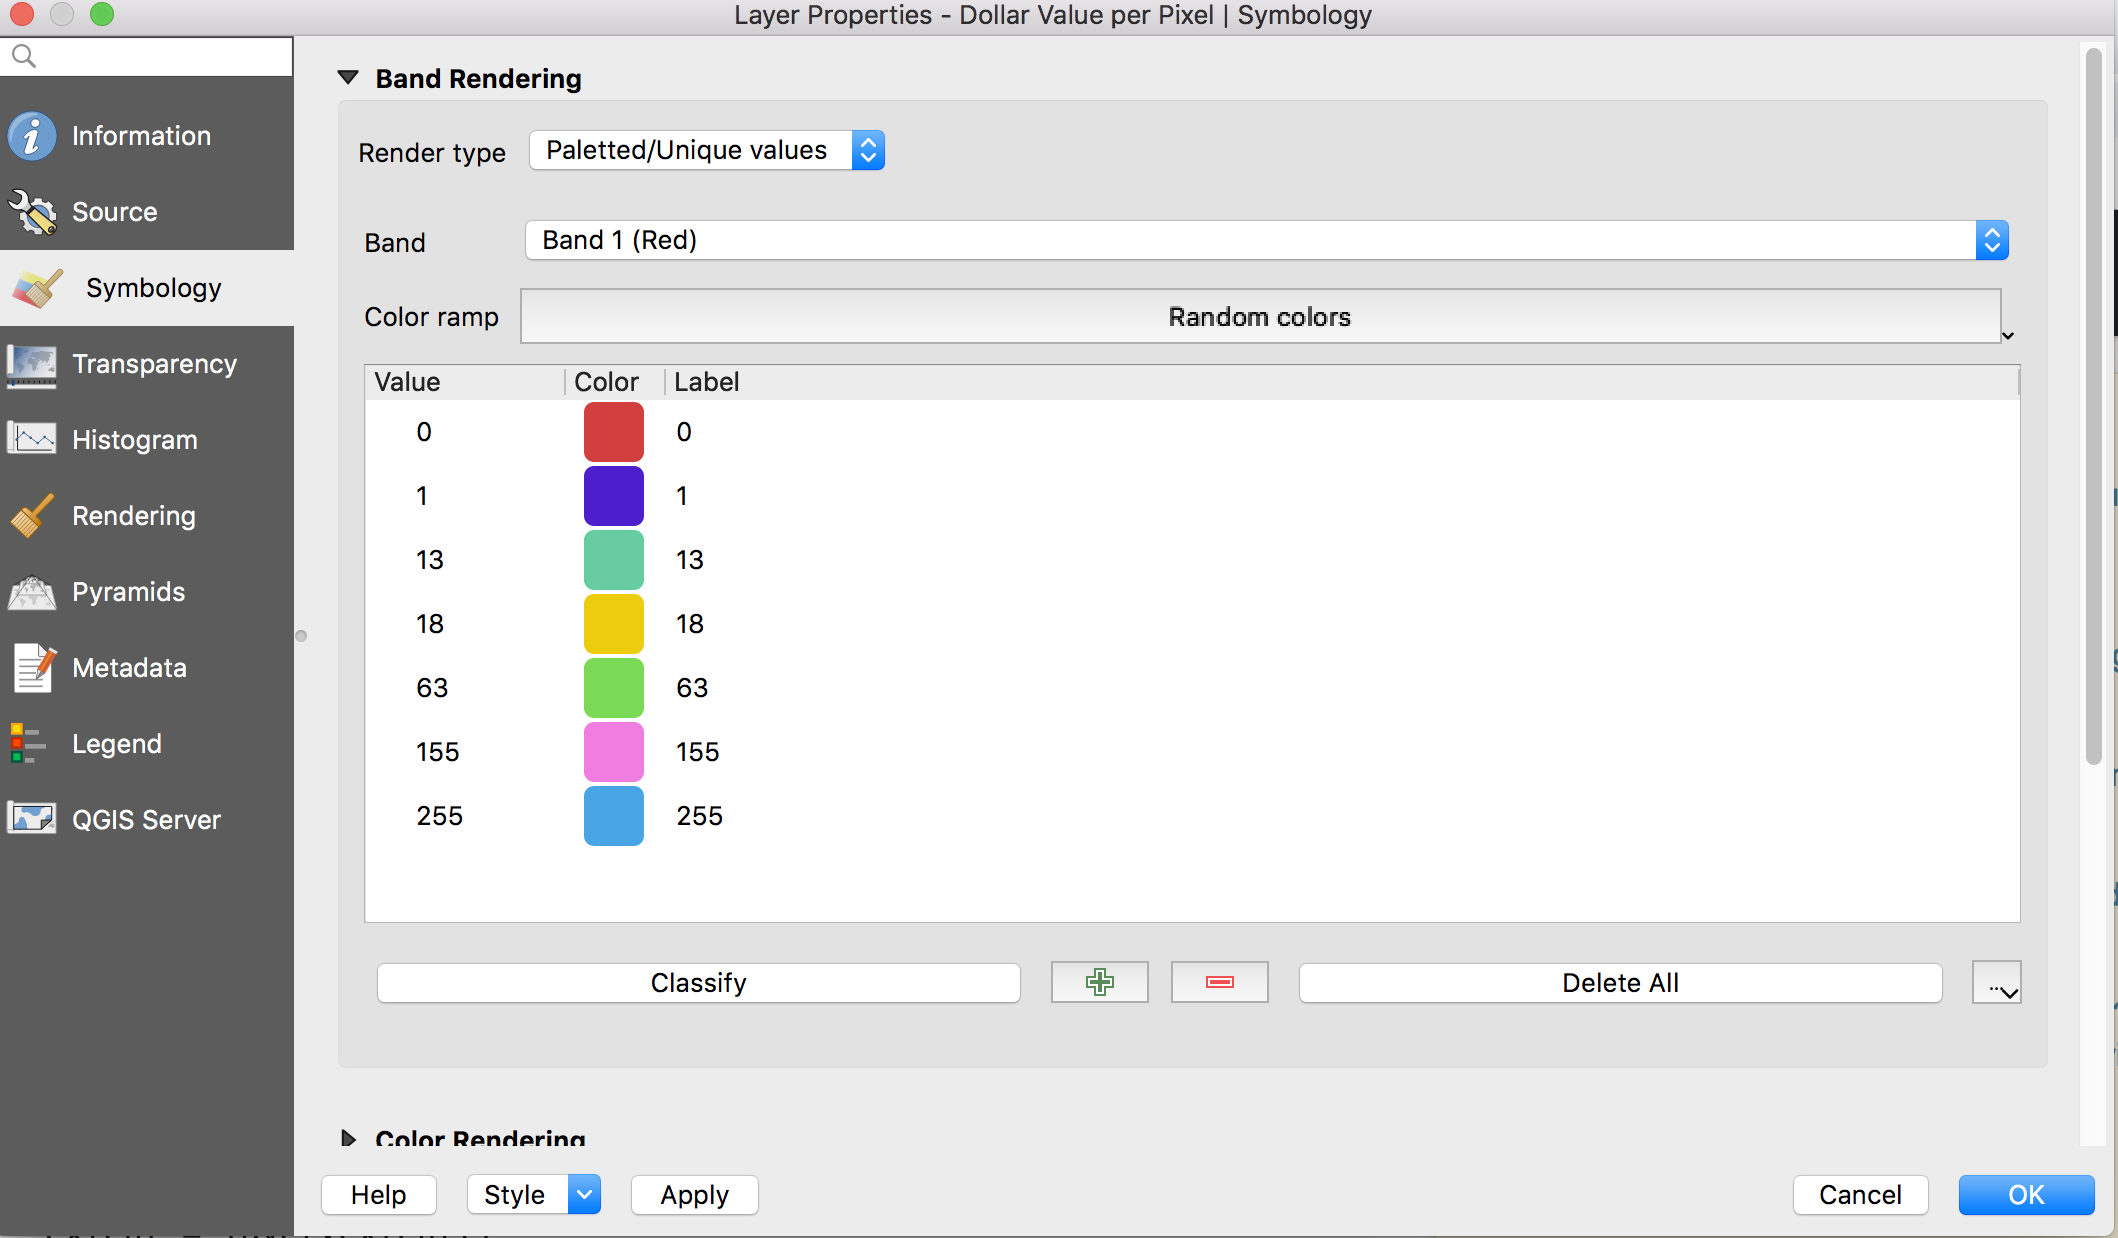
When I start, I find it helpful to ask myself: “What object am I working with?”. This clues me in to what methods, attributes, and as I get more experienced, what PyQGIS classes I might be working with. There are many types of things I could be manipulating with python including layers, maps, databases, etc. In this case, the object I am working with is a layer in my map. I like to get as much help as I can with my objects so I will run this help tool in the console:
print(help(layer))                 #you can call help directly on variables you've created
print(help(iface.activeLayer())    #you can call help this way too
In my project, I am working with a raster layer, which is an instance of the class QgsRasterLayer. Looking at the documentation I can now see all the methods, attributes, etc. available for that layer, including parent classes and arguments needed if I use this class while coding. Next, I print the name of the layer (in the console), just to make sure things are working:
print("Active Layer: ", layer.name())
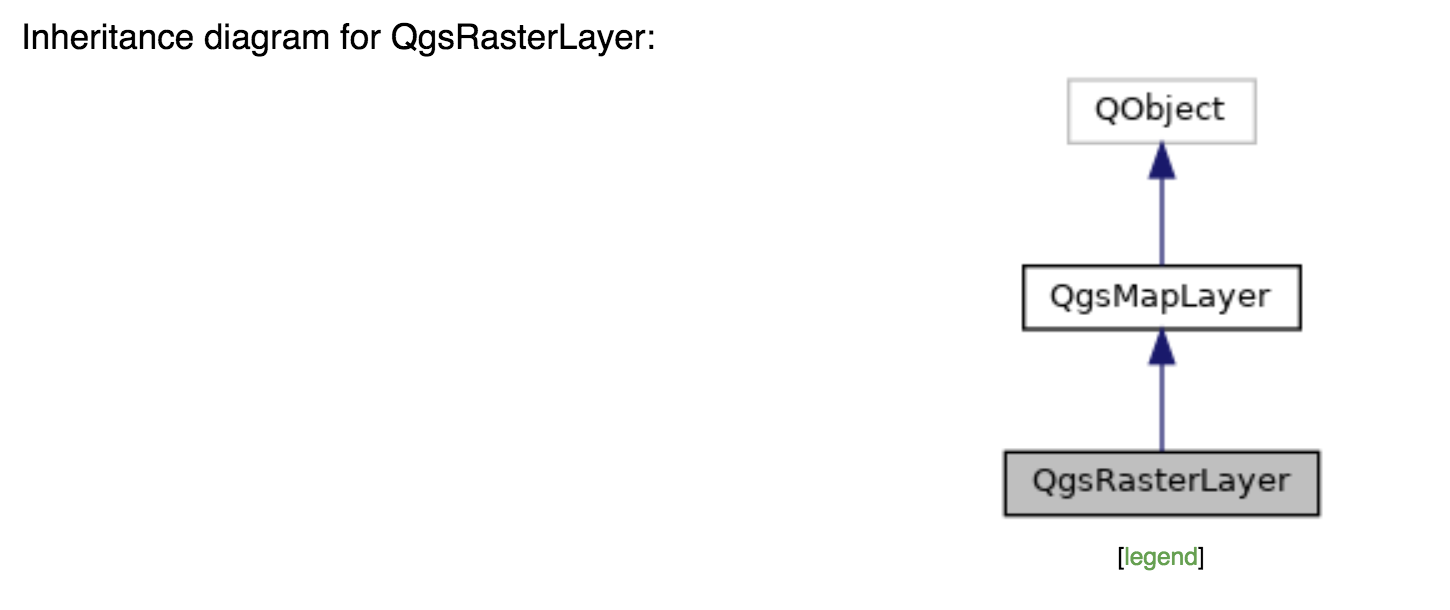
You can see I have a variable “layer” and called the method .name(). If I look through the QgsRasterLayer documentation, you will not see the method .name() listed. So where did this come from? The answer is class inheritance. Looking at the class inheritance diagram from the C++ documentation, I see that QgsRasterLayer’s inheritance diagram is not very complex, so let’s also look at QgsVectorLayer’s inheritance diagram as it is similar.
As you can see, QgsVectorLayer has a lot more action:
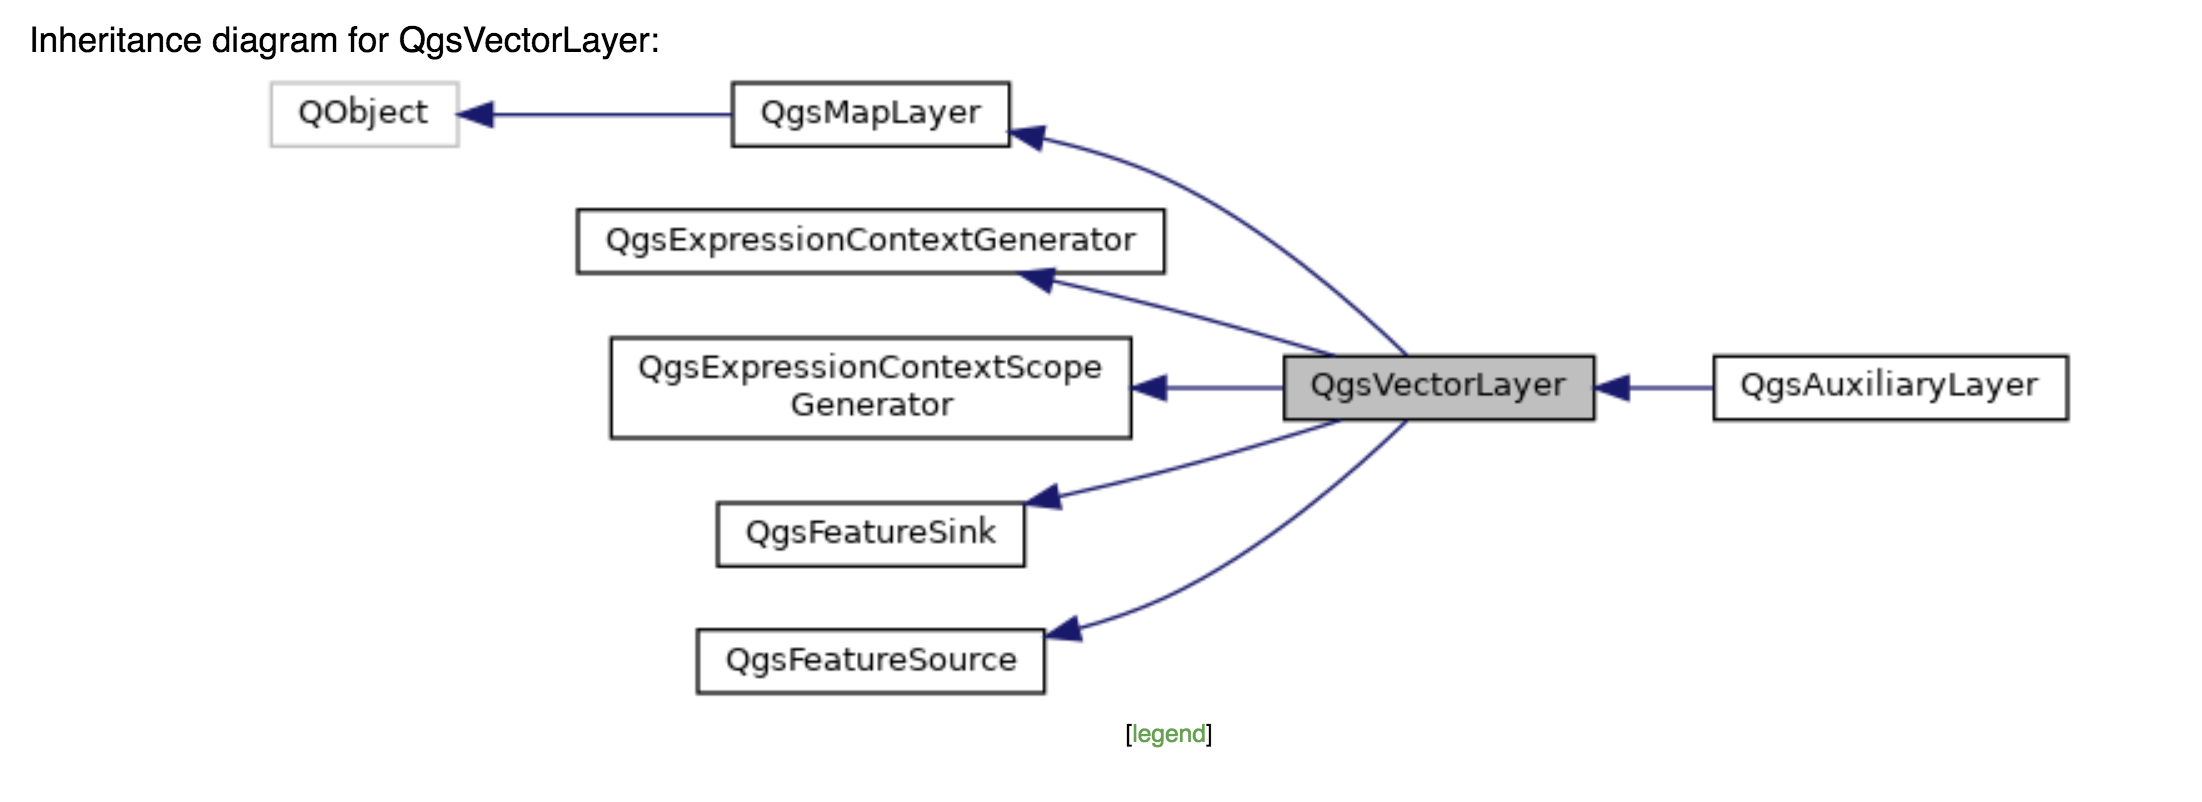
QgsRasterLayer and QgsVectorLayer share many attributes and methods because they inherit from a common parent class, QgsMapLayer You can see, I used the name() method on my active layer, but where did this come from? Because class inheritance allows a class to inherit from its parent classes, there are potentially many more methods and attributes available to each class than are listed in the documentation. I found the name() method inside the parent class, QgsMapLayer. This step in the process feels a bit like a wild goose chase to me. QgsMapLayer only hase one parent class but In the case of QgsVectorLayer (and many other classes), it inherits from many classes which all contribute a lot of functionality. I really don’t know an effective way to sift through all this except through experience. After a while, you just know what is available via various base classes. If you know a better way, let me know!
Anyway, the layer name is an aside. Back to the example. Here are the next two lines of code:
provider = layer.dataProvider()
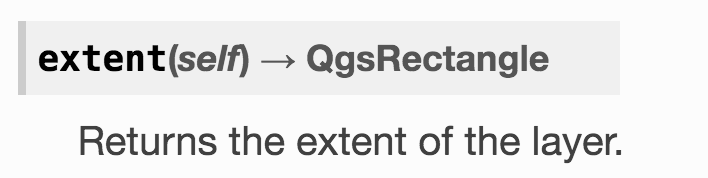
extent = layer.extent()
QgsRasterLayer provides one of these methods, dataProvider(). But there is no information listed. How am I supposed to know what this method does? Here you see a limitation of an open-source software project like QGIS. It is not someone’s job to do make sure all the documentation is complete, like it is for someone at ESRI. Luckily, QgsMapLayer provides both this method and extent() with more information. Lesson: it is worth taking a look at the base class(es) to see what information is available.
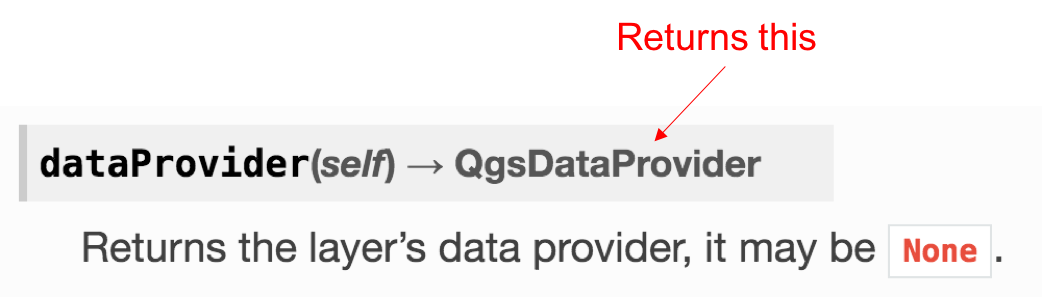
The dataProvider method is particularly interesting because of what it returns, a QgsDataProvider object, which I have highlighted in the image above. This will actually be a QgsRasterDataProvider object because I am working with a raster layer. In the code, you can now see I move on to working with the QgsRasterDataProvider object:
#think of provider.bandStatistics() as shorthand for QgsRasterDataProvider.bandStatistics()
stats = provider.bandStatistics(1, QgsRasterBandStats.All)
Let’s keep in mind the original goal. I want to read the pixel values of cells in a raster layer, as I did in the properties
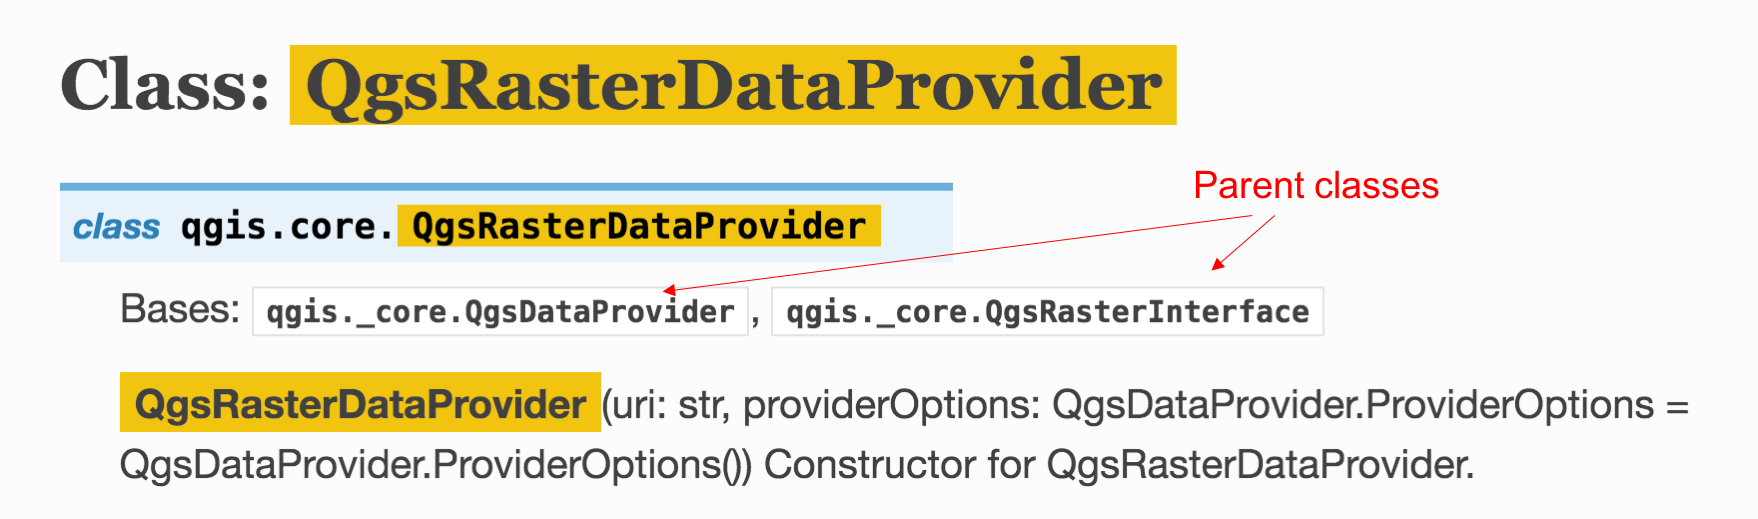
symbology tab of my raster layer. If you go to my original StackOverflow thread I was lucky enough to receive several responses. Basically there are two trains of thought on this solution. But first, let’s look at the bandStatistics() method I used above. Again, this method is inherited by QgsRasterDataProvider from its parent class, QgsRasterInterface. Let me show you another way to identify class inheritance, this time using the python documentation. The C++ inheritance diagrams are easier to understand, as they offer a nice visual, but below you can see I’ve identified the parent classes to QgsRasterInterface.
You will notice I included 2 arguments in the bandStatistics method > (1, QgsRasterBandStats.All). The documentation for the bandStatistics method is helpful (lucky us!) and explicitly states what we need to include as arguments and what those arguments should be:
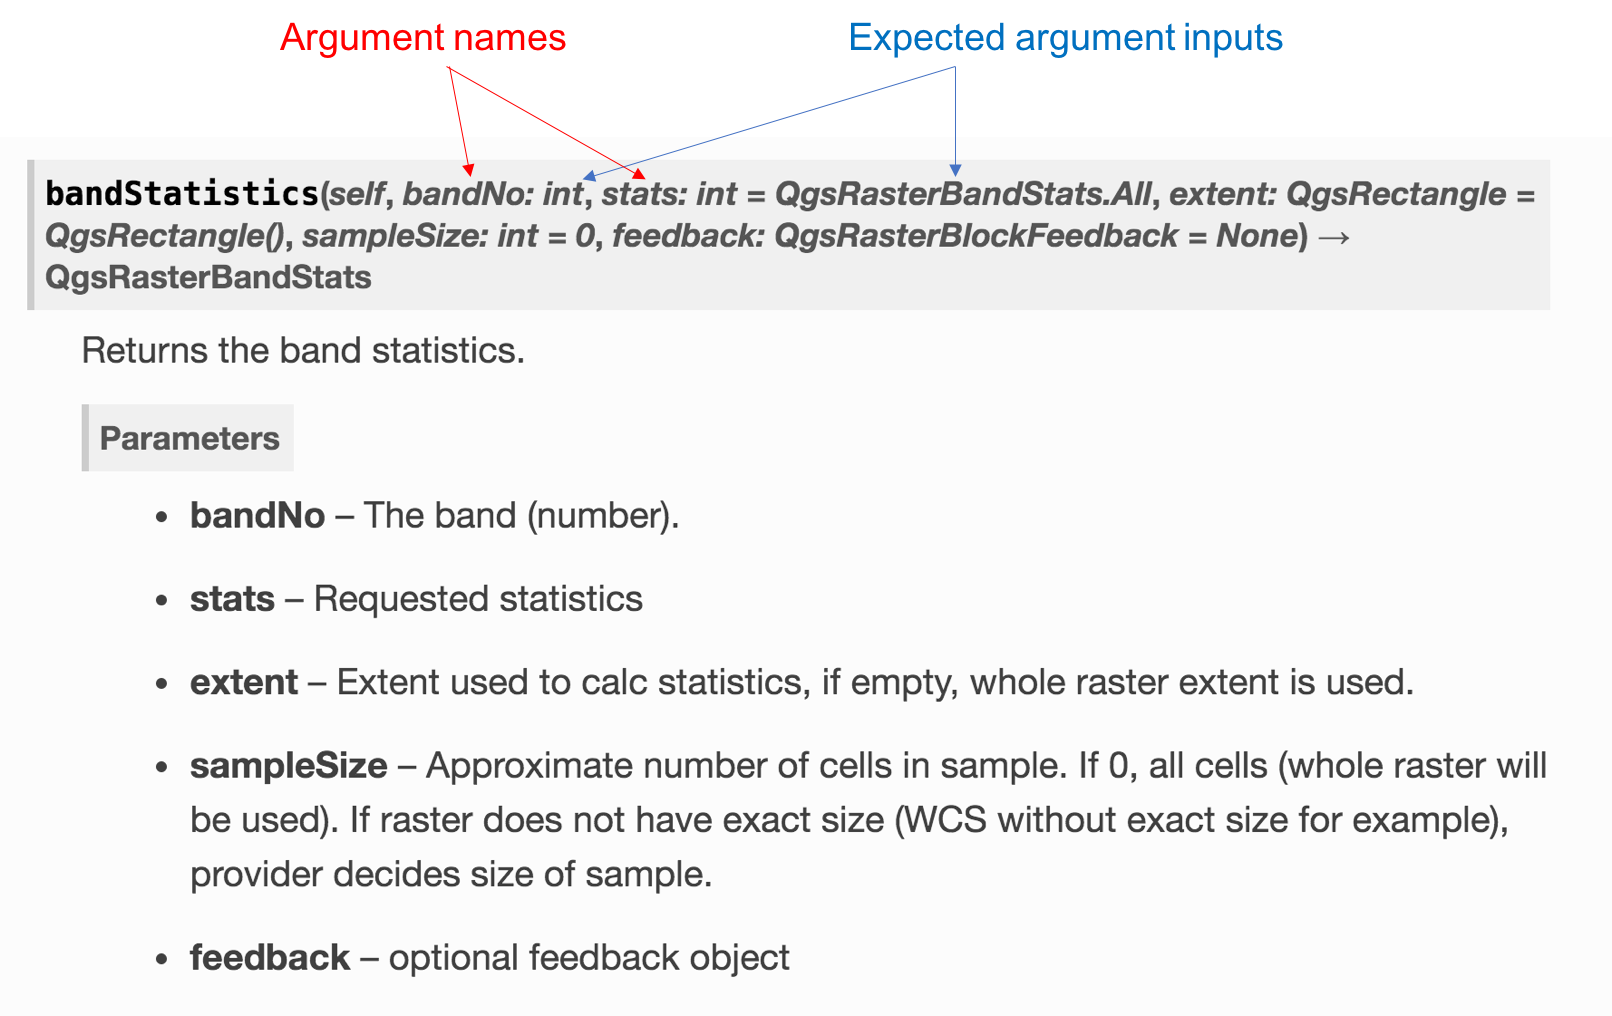
I only included two arguments, more are available. The first is the band number, for which QGIS expects an integer. My raster has only one band, so my input is 1. Next argument is stats, or statistics. The default argument here is QgsRasterBandStats.All. Now that I have a “stats” object, I can see some of its attributes like minimum value, maximum value, standard deviation, range, mean and so on. Here is an example:
print(stats.minimumValue)
print(stats.maximumValue)
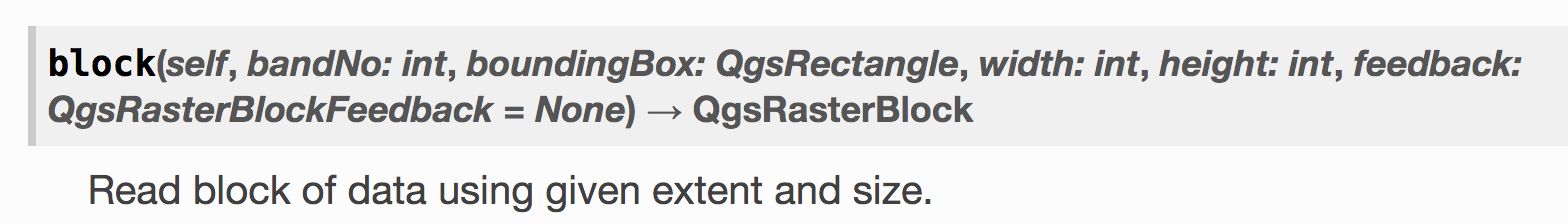
This is nice, but I want more granularity, similar to what is shown in the “symbology” screenshot above. I want to see the raster values and a count of those values. The first solution I explored used the block() method from the QgsRasterDataProvider class. Here is the code and documentation screenshot:
rows = layer.height()                    #need width and height to include as arguments in block() method
columns = layer.width()

block = provider.block(1, extent, columns, rows)
This returns a QgsRasterBlock object. Now I can do some regular python magic to parse this QgsRasterBlock object, iterating over it just like I would with other lists and things. I will do this very verbosely to make it clear how I’m looping through these objects instead of combining them in list comprehensions.
values = []
for row in range(rows):
    values.append([])                       #creates a list of empty lists, one empty list for each row of the raster

for row in range(rows):                           #iterates through each row
    for column in range(columns):                 #iterates through each column
        values[row].append(block.value(row, column))    #block.value reads value of individual raster cell, appends it to corresponding list in values

flattened_list = []                       #makes one list with the all the numbers in values
for list in values:
    for element in list:
        flattened_list.append(element)

unique_values = []                        #makes list of just the unique values in flattened_list
for item in flattened_list:
    if item not in unique_values:
        unique_values.append(item)

for item in unique_values:                #for unique_values, counts occurrence of each value, prints output
    count = 0
    for element in flattened_list:
        if element == item:
            count += 1
    print(f"Value: {item}, Count: {count}")
And here is a screenshot of the output. You can see I included print statements along the way to make it very clear what each step is doing and so I could check myself along the way. Also, note that your results will be different because you’ll be using a different raster layer. Lastly, I clipped just a tiny part of my raster layer for the sake of this demonstration, as you can see I only have 9 pixels. If you are iterating through a raster with many thousands (or millions) of pixels, this process might take a while!
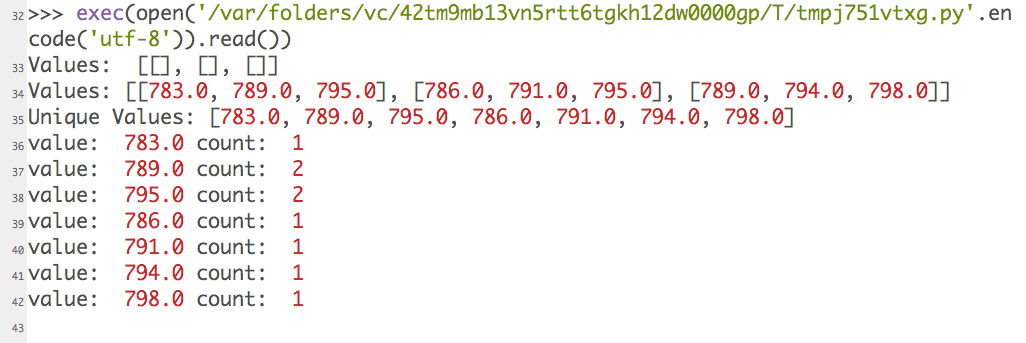
I included very verbose nested for loops and print statements. Why not use list comprehensions and shorten things up? Well, you probably should but I wanted to make things as clear as possible for the sake of this example. This seems like a lot of work to me though. I had to do many nested loops, not to mention the processing time this could take if you have a large raster file. For that reason alone I see the utility of this method somewhat limited. Isn’t there a better solution?
It turns out there is an initHistogram() method available in the QgsRasterDataProvider class. We can initialize the histogram, which returns a QgsRasterHistogram object. The docs for QgsRasterHistogram are rather sparse. There are a few attributes available, but no information about them. It seems the histogramVector attribute is the most likely to return something resembling what is available in the properties>symbology tab. Here is the code for the previous few steps:
provider.initHistogram(QgsRasterHistogram(),1,100)     #arguments are QgsRasterHistogram, band number, bin number
histogram = provider.histogram(1)
print(histogram.minimum)              #this works, prints minimum value in raster layer's histogram
histogram.histogramVector             #this does not work, QGIS crashes
So as you can see, it appears we’ve run into a potential bug in QGIS. Calling the histogramVector attribute of a QgsRasterHistogram object causes QGIS to crash. I was struggling and created this StackOverflow thread where Anita Graser, member of the core QGIS development team, responded. Basically, it appears histogramVector doesn’t work. I was a bit frustrated with this but eventually took a zen approach that QGIS is imperfect and is a work in progress.
I will finish this post with two full code examples which you should be able to copy and paste, adapt, change, etc. to suit your needs.
1st solution, using the block() method:
layer = iface.activeLayer()
print("Active Layer: ", layer.name())
provider = layer.dataProvider()
stats = provider.bandStatistics(1, QgsRasterBandStats.All)

extent = layer.extent()
rows = layer.height()
columns = layer.width()

block = provider.block(1, extent, columns, rows)

values= []
for row in range(rows):
    values.append([])
print("Values: ", values)

for row in range(rows):                   #iterates through each row
    for column in range(columns):         #iterates through each column
        values[row].append(block.value(row, column))   #appends the block.value to each position in values lists
print(f"Values: {values}")

flattened_list = []              #flattens values lists into one list
for list in values:
    for element in list:
        flattened_list.append(element)

unique_values = []
for item in flattened_list:
    if item not in unique_values:
        unique_values.append(item)
print("Unique Values:", unique_values)

for item in unique_values:
    count = 0

    for element in flattened_list:
        if element == item:
            count += 1
    print ("value: ", item, "count: ", count)
2nd Solution (sort of), using QgsRasterHistogram and the histgramVector attribute:
layer = iface.activeLayer()
provider = layer.dataProvider()
provider.initHistogram(QgsRasterHistogram(),1,100)
histogram = provider.histogram(1)

print(histogram.minimum)               #this attribute works
histogram.histogramVector              #this attribute crashes the program
Keep in mind, this is meant to be a process oriented problem solving approach. The content is not necessarily the important part here, it is the step-by-step examination of how to combine all these classes, methods, attributes, documentation, etc into a solution.