How To Apply A Graduated Color Symbology With Python In Qgis 3
The biggest reason I write in this blog is to provide myself with good records and explanation of programming (or other) problems that trip me up. If I can document the issue while its still fresh in my mind, I will hopefully be able to refer back to it here without having to re-invent the wheel.
I was recently working on a project with a member of University of Virginia Health’s Oncology department. This person wanted to take a set of patient data (after identifying info had been removed) and represent the geographical distribution of those patients by US Zip Code. This workflow involved many steps, one of which was to apply a graduated color scheme to the data, shading them from light to dark based on # of patients in each zip code.
I needed to write this in a script to automate this with Python in QGIS 3 (QGIS 3.4 in my case). This ultimately turned out to be pretty easy to do but not before I spent quite a few hours online trying to figure it out. One major struggle was that many examples were from earlier versions of QGIS (QGIS 2.18 for example) and the code doesn’t always translate nicely. Most of what I did find was from various StackOverflow threads as well as the PyQGIS Developer’s Cookbook. Hopefully this serves as a guide for you to apply a graduated symbology to a layer in QGIS 3 using Python. In this example I’m going to use a subset of the data and walk through the steps. Download the sample data and you should be able to reproduce this with minimal changes to my code.
You can find the sample dataset for this example here
This is a shapefile with a handful of zip codes in Virginia.
My code example is basically a simplified version of the above PyQGIS Cookbook link with some more description of particular features. Anyway, lets start from the top. If you’ve downloaded the sample layer, you have a shapefile with zip codes and in that layer’s attribute table is a column called ‘Patient_Da’. This is short for “Patient Data” and shows a count of number of patients by zip code. Here is the full code:
uri = '/Users/ep9k/Desktop/TestZipCodes/TestZipCodes.shp'
join_layer = iface.addVectorLayer(uri, 'Patients by Zip Code', 'ogr')
target_field = 'Patient_Da'

def apply_graduated_symbology():
"""Creates Symbology for each value in range of values.
    Values are # of patients per zip code.
    Hard codes min value, max value, symbol (color), and label for each range of
    values. Then QgsSymbolRenderer takes field from attribute table and item from
    myRangeList and applies them to join_layer. Color values are hex codes,
    in a graduated fashion from light pink to black depending on intensity"""

    myRangeList = []

    symbol = QgsSymbol.defaultSymbol(join_layer.geometryType())
    symbol.setColor(QColor("#f5c9c9"))
    myRange = QgsRendererRange(0, 3, symbol, 'Group 1')
    myRangeList.append(myRange)

    symbol = QgsSymbol.defaultSymbol(join_layer.geometryType())
    symbol.setColor(QColor("#000000"))
    myRange = QgsRendererRange(3.1, 6, symbol, 'Group 2')
    myRangeList.append(myRange)

    myRenderer = QgsGraduatedSymbolRenderer(target_field, myRangeList)
    myRenderer.setMode(QgsGraduatedSymbolRenderer.Custom)

    join_layer.setRenderer(myRenderer)

    print(f"Graduated color scheme applied")

apply_graduated_symbology()
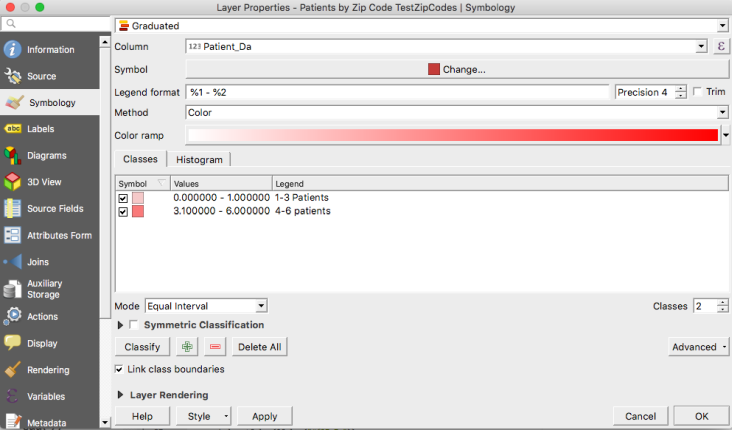
First, I want to show you what this would look like using the “symbology” tab of the GUI in QGIS. If you right-click on the layer and go to “properties” > “symbology” you should see this:
In the first three lines I created a uri which is the path to where my file is stored. You should modify your pathname accordingly. Then, I create the join_layer object and add the layer to my map. Finally, the target_field object is the ‘Patient_Da’ column in the attribute table of my join_layer, which is the sample data set:
uri = '/Users/ep9k/Desktop/TestZipCodes/TestZipCodes.shp'
join_layer = iface.addVectorLayer(uri, 'Patients by Zip Code', 'ogr')
target_field = 'Patient_Da'
Now, I created a function called apply_graduated_symbology() with no arguments. You can see from my docstring that this creates symbology for each value in a range of values. I specify this range of values and create a custom symbol for each. In the next few lines, I create a list object called myRangeList and set it to an empty list. This will hold the symbol for each range of values.
Next, I create a variable called symbol. symbol first stores the geometry type of the layer, which in this case is a polygon. Yours might be a line or point (marker). Insert a print statement here if you want to determine what yours is. Then, I set the color for this geometry type. I manually specified this color using a hex string (“f5c9c9”). This hex string is a pinkish color.
Then, create myRange. This creates a QgsRendererRange which takes the following arguments: (min value, max value, color, label). You can see that I hard coded the min, max, and label. The color I already defined and stored in symbol. You can do something more advanced here to calculate the min and max if needed. Lastly, I append this to the myRangeList
symbol = QgsSymbol.defaultSymbol(join_layer.geometryType())
symbol.setColor(QColor("#f5c9c9"))
myRange = QgsRendererRange(0, 3, symbol, 'Group 1')
myRangeList.append(myRange)
Notice I did this sequence twice, for two ranges of values. The first is for 0-3 patients, the second is for 4-6 patients. You can add as many breaks as you like here. I am only using two for this simple example. Anyway, myRangeList now has two objects in it. The last few lines implement the code we’ve written. myRenderer creates an object which stores the QgsGraduatedSymbolRenderer object with the field name (target_field from above) and myRangeList (which stores the QgsRendererRange values for each break as arguments). Then we define the mode as “Custom”. You could also use other modes such as Natural Breaks or Jenks. Lastly, you must render your layer and apply the graduated symbology. join_layer.setRenderer(myRenderer) does this. Take a look at the last few lines of code again:
    myRenderer = QgsGraduatedSymbolRenderer(target_field, myRangeList)
    myRenderer.setMode(QgsGraduatedSymbolRenderer.Custom)

    join_layer.setRenderer(myRenderer)

    print("Graduated color scheme applied")

apply_graduated_symbology()
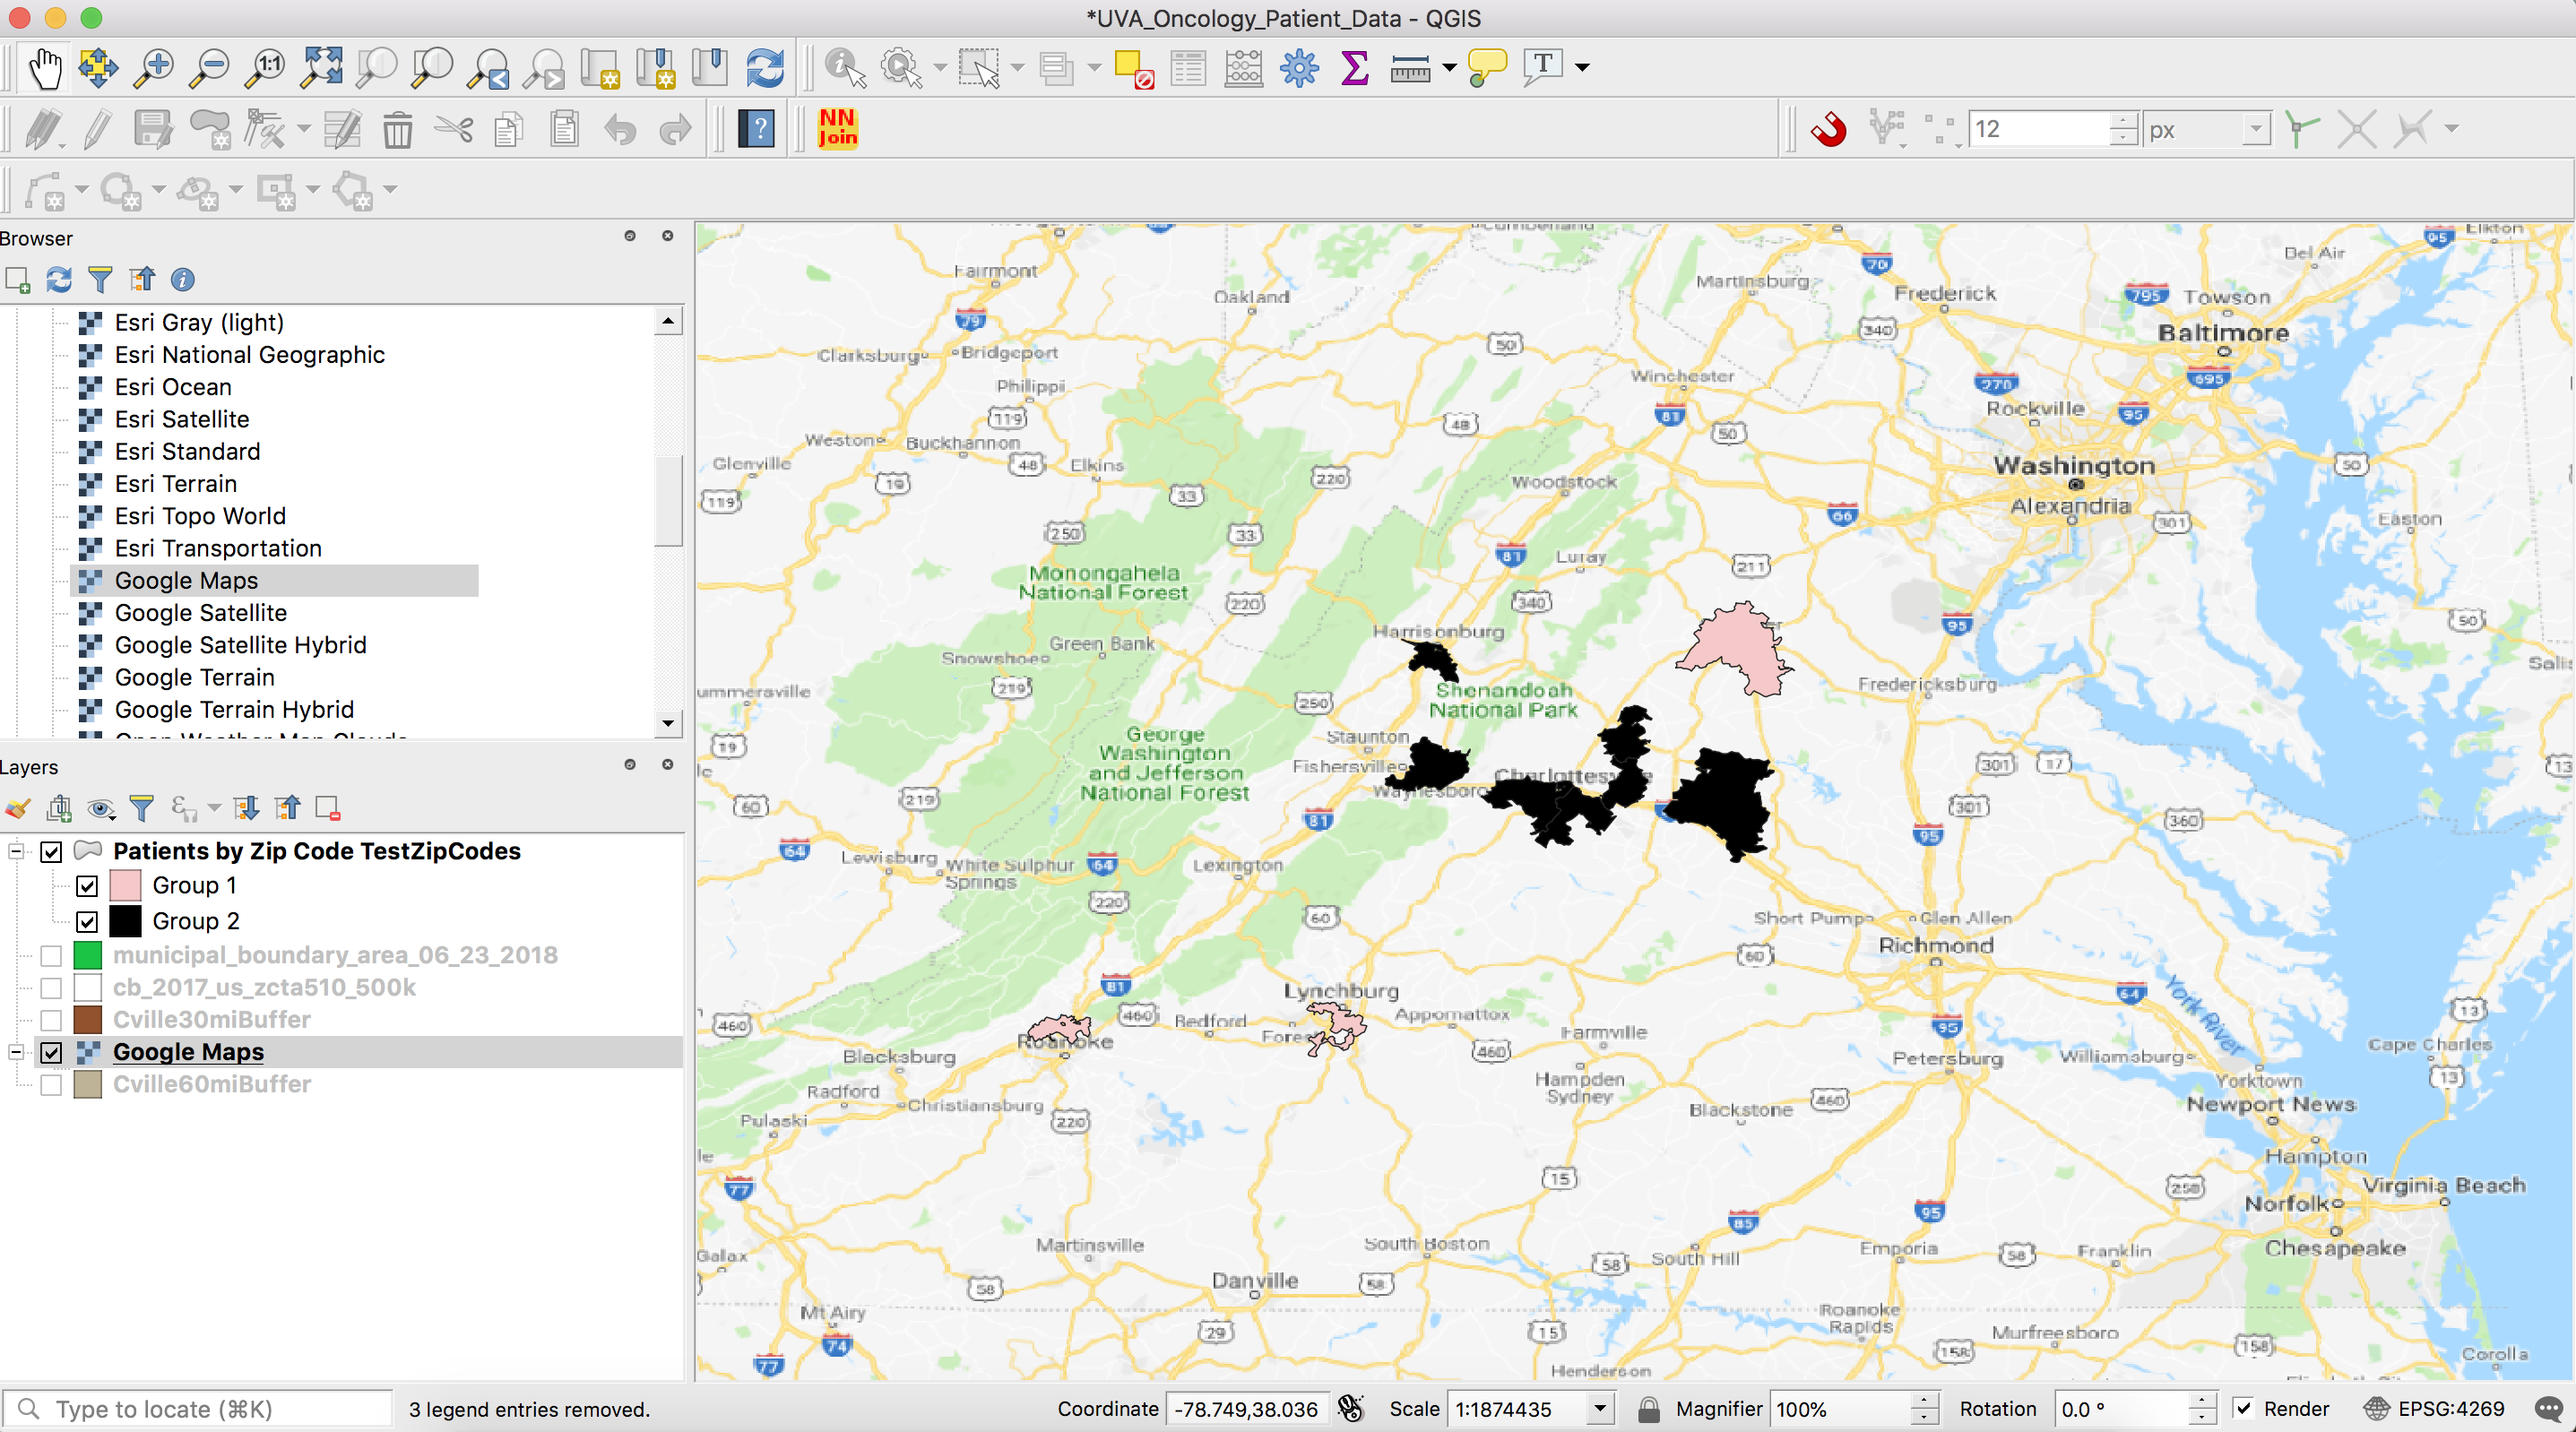
I finish with a print statement telling me this function ran and then execute the function outside the function block. In the end your output should look like this (I also added a basemap):
And there you have it. That is really all there is to it. As I previously stated, though this is pretty simple functionality I wrote this because I really couldn’t find a great example resource to use so hopefully this serves as that for you.