
MAPSIMISE USER MANUAL
Overview
Mapsimise Organization Homepage: https://boonerealestate.useast.mapsimise.com
Username: epurpur@gmail.com Password: Battlebot4$
The landing page looks like this:
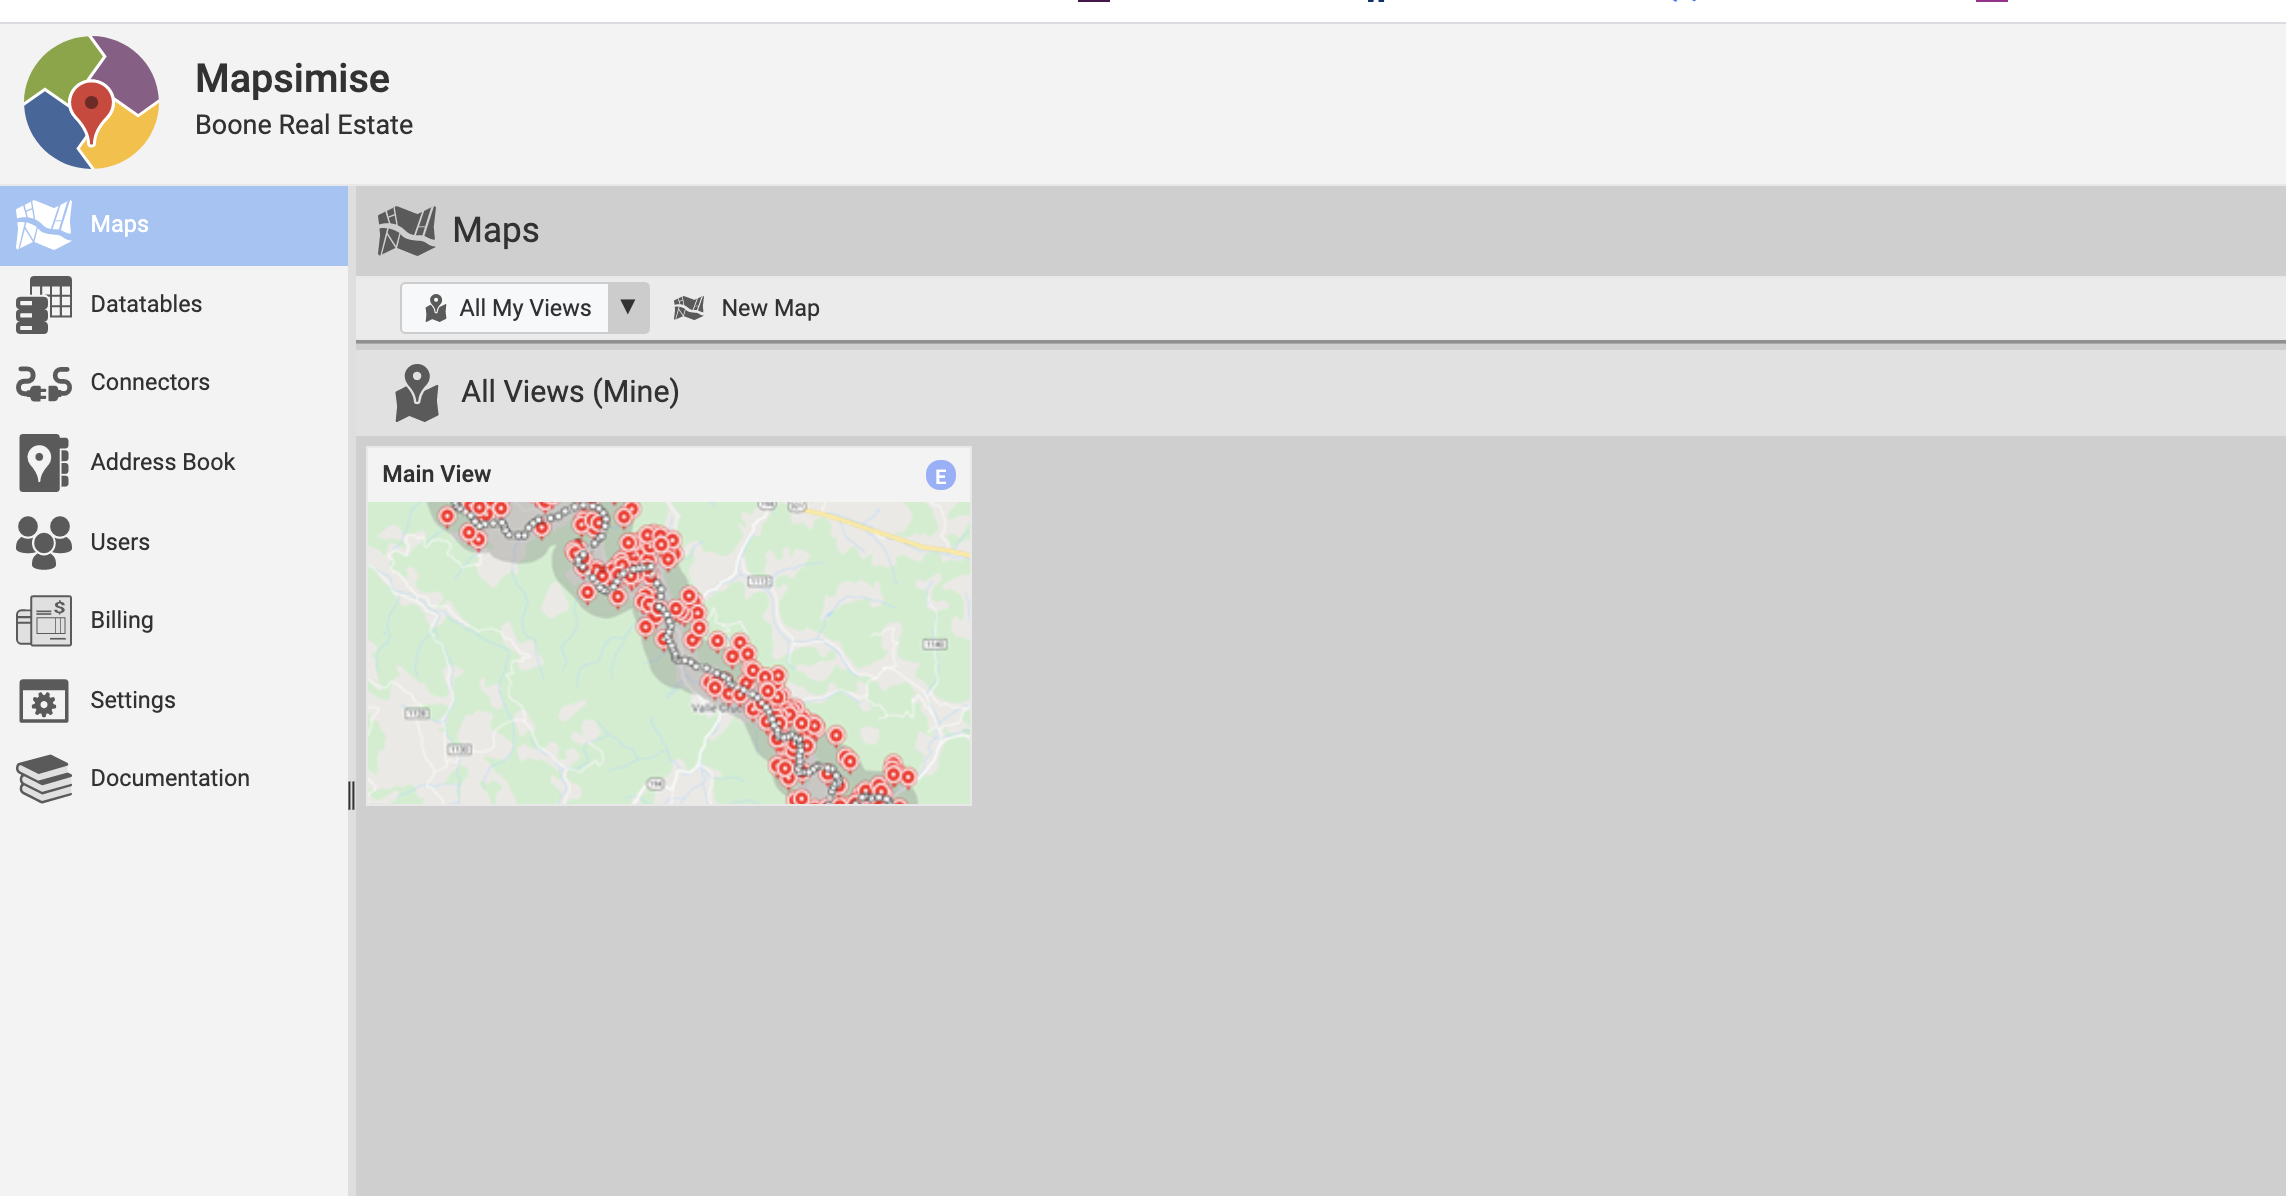
We only have one map with 1 view. The views are basically just different ways of looking at the same data but for our sake I didn’t feel like different views were necessary.
Salesforce Connector
This is where we connect to Salesforce. Interfering with this or deleting/reconnecting will
remove all the data filters I have created. No touchy!
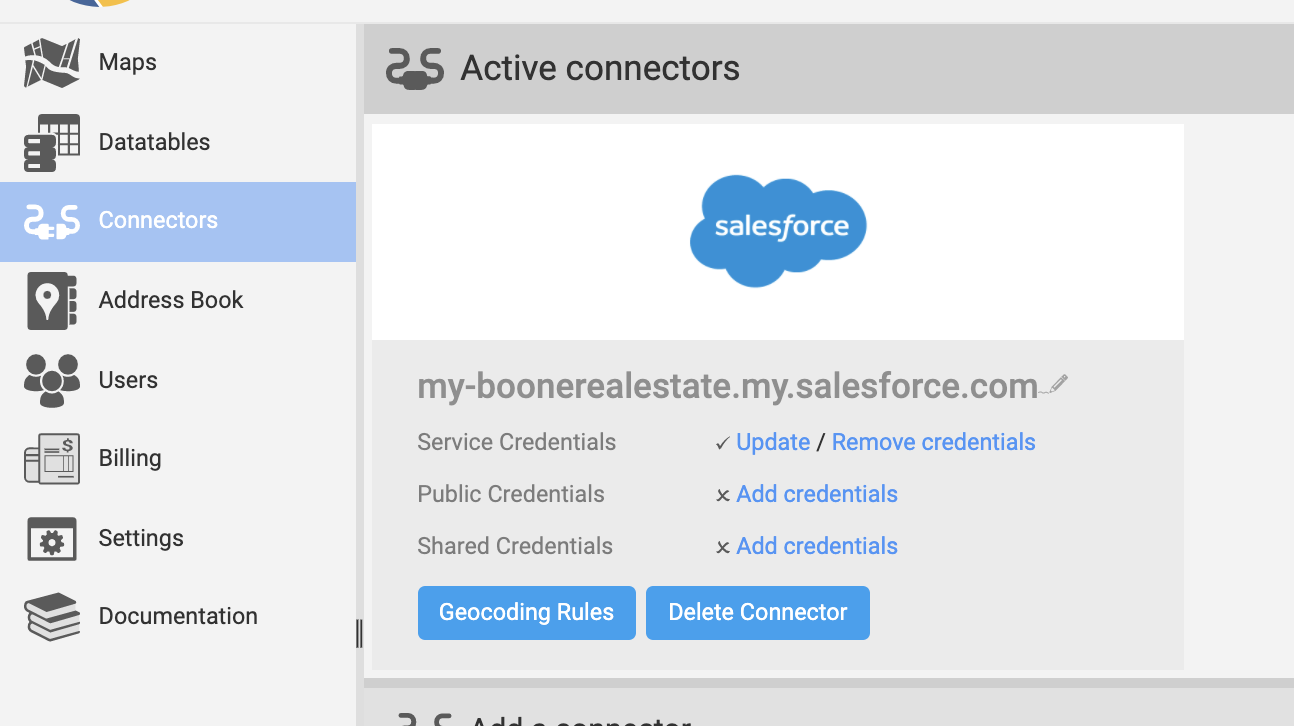
Current Salesforce Security token (as of 12/2/20) ; HWoBWA8bqCUfe3NJrJxuoO2o
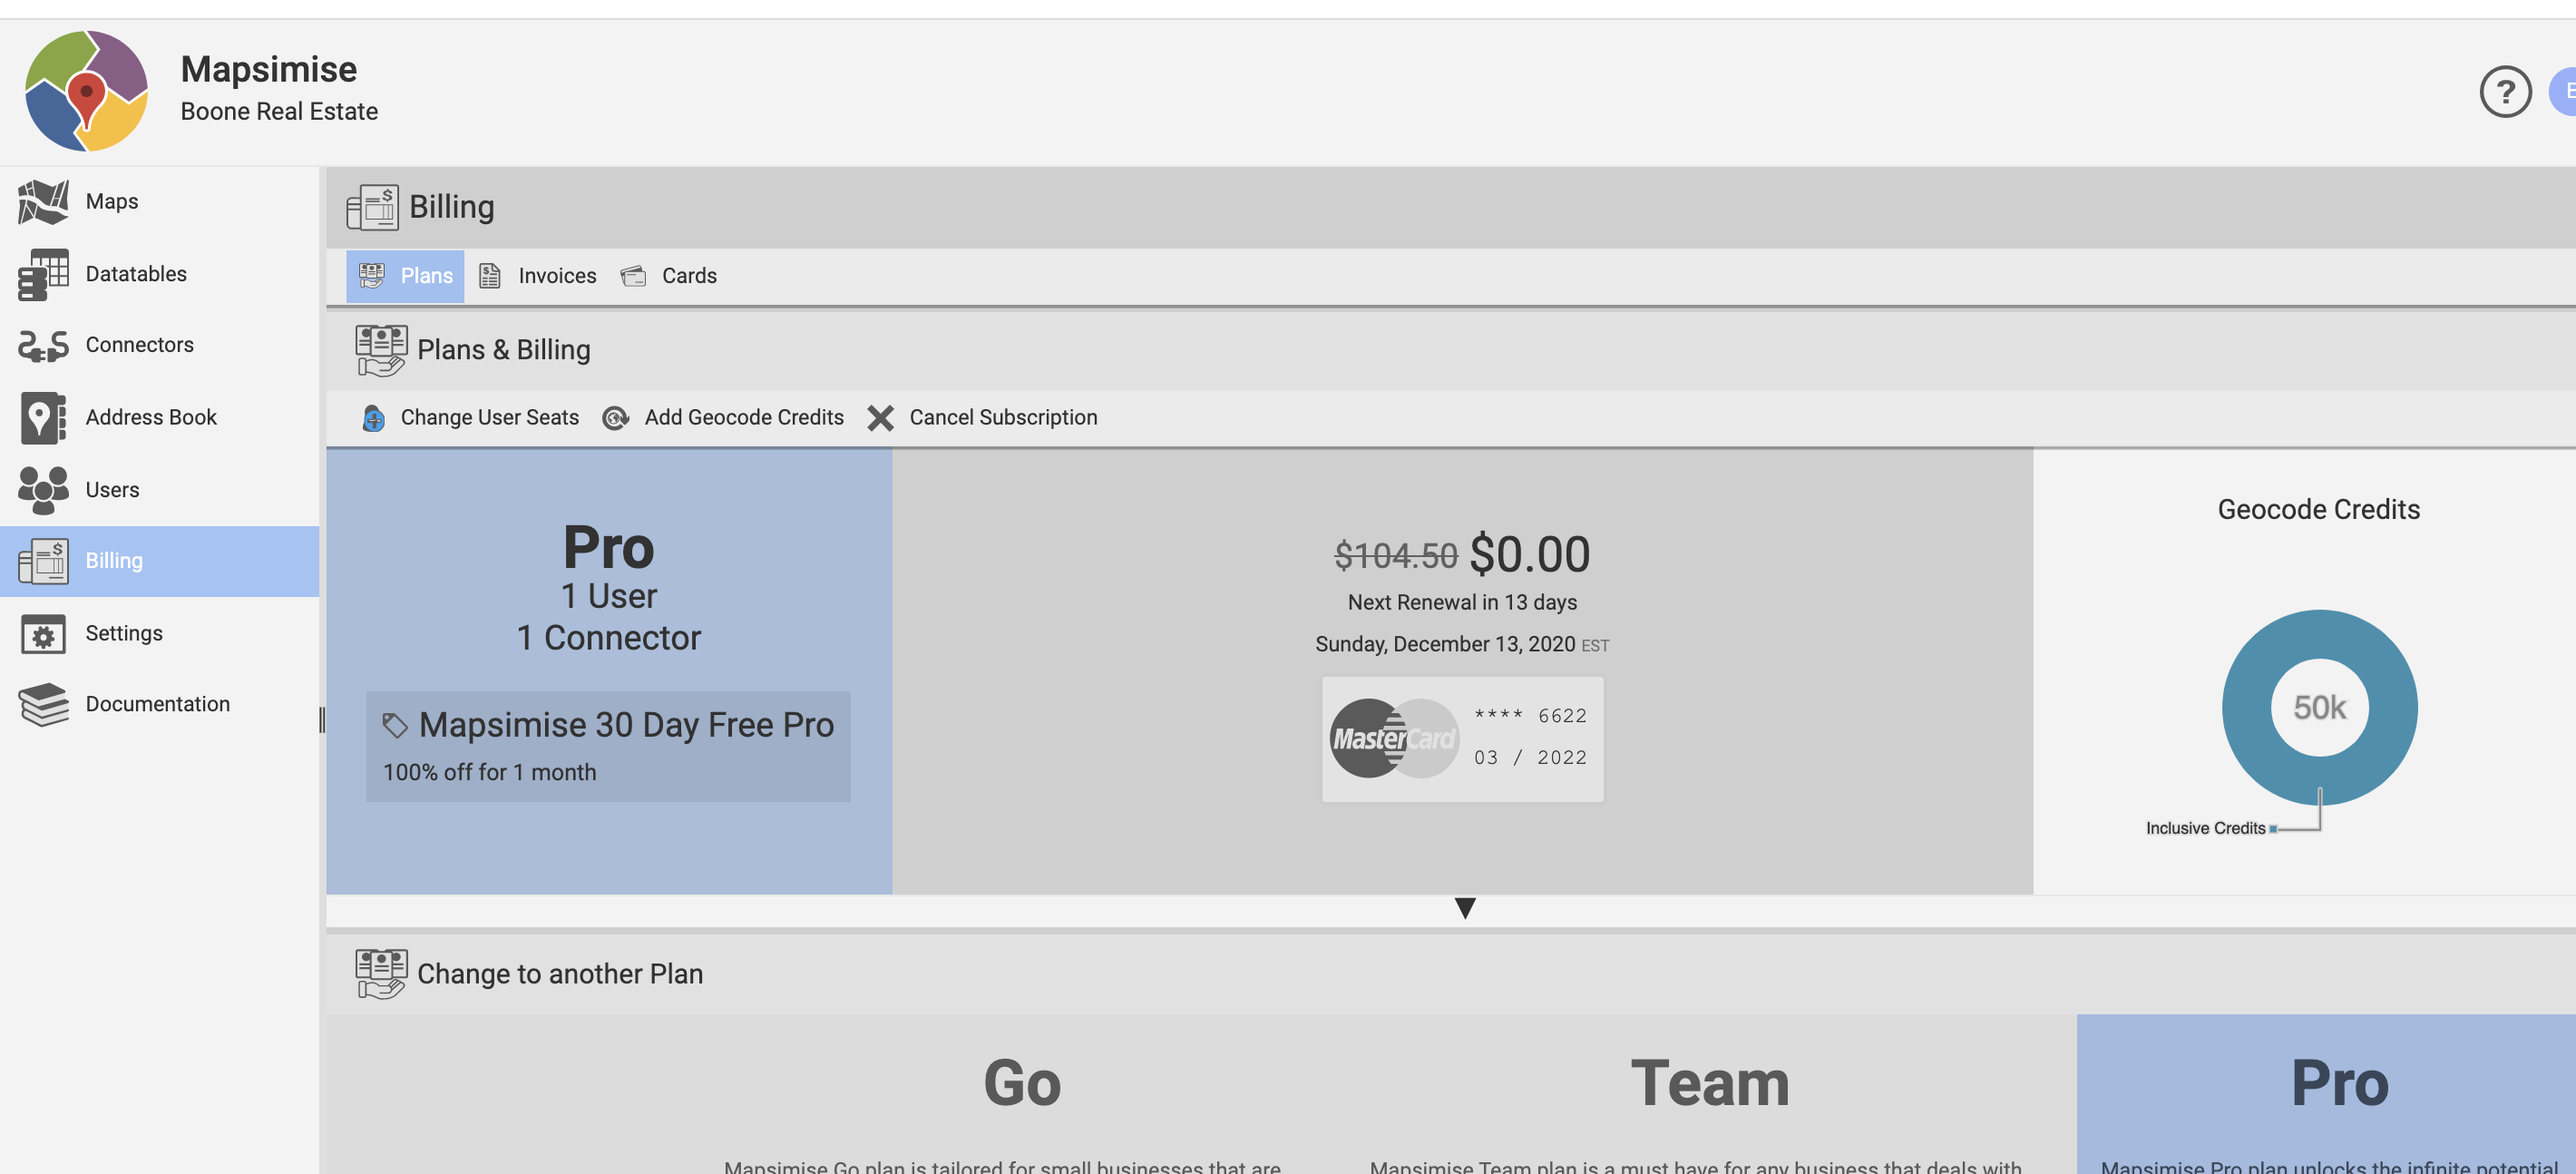
Billing
The billing page shows your subscription and payment information.
Available Layers
In the bottom left of the page, you’ll see several layers which you can toggle on and off. These are actually all the same data, which is the DirectMail object from Salesforce. The difference between them is they each have a different data filter applied to them. In order to make Mapsimise more straight-forward to use, I’ve named each layer the same as its corresponding data filter name. The data filter can be changed but this would defeat the purpose of the current setup.
Condos Layer : Shows records with property type of “condo”, “townhome”, or “condo/townhome”. Any record with data in the 2+ Removed field is excluded. Any record with a Date Mailed in the last x amount of days is excluded.
Vacant Land Layer : Shows all records with property type of “Vacant Land” and gisacres of <= 10 and parval of >= $100,000. Also shows records with property type of “Vacant Land” and gisacres of >= 10 and parval of >= $200,000. Any record with data in the 2+ removed field is excluded. Any record with a Date Mailed in the last x amount of days is excluded.
Homes Layer : Shows records which meet the following criteria. Property Type is either “Home” or “Home / Potentially Not Residential” (because we can’t always distinguish in some counties). Then each zone (1a through 6a) and the price filter for each respective zone. Any record with data in the 2+ removed field is excluded. Any record with a Date Mailed in the last x amount of days is excluded. This filter took a long time to create. Please don’t delete it!. You can modify this by changing any of the prices for each zone.
Combined Layer : Think of this as a combination filter. Shows all records which meet the criteria of any of the condo, vacant land, or Homes filter. Any record with data in the 2+ removed field is excluded. Any record with a Date Mailed in the last x amount of days is excluded.
Filtering Data
There are several ways of filtering data.
Data Filters
Data filters are placed on the data via the attribute table of the dataset. For example: View all records which have the property type of “Home”. You can use two filters at once. For example, you can use a data filter and a geographical filter on the data.
To select a data filter click on the three horizontal bars button next to the ‘master list’ layer in the bottom of the main map screen. 
Click ‘data filter’ and you’ll see a dropdown bar which allows you to select different options. You should always view the data with a data filter. Otherwise, it’ll take a while for the program to load 230,000 records. There are four custom data filters, which I created that you should not delete, along with a few others. Here are the data filter options:
No Data Filter : Just as it says, no filtering of the dataset. This views all records.
New Data Filter : Create a custon new view of the data. I imagine both you and I will use this because we are always tweaking the way we look at the data.
Condo Filter : Shows records with property type of “condo”, “townhome”, or “condo/townhome”. Any record with data in the 2+ Removed field is excluded. Any record with a Date Mailed in the last x amount of days is excluded.
Vacant Land Filter : Shows all records with property type of “Vacant Land” and gisacres of <= 10 and parval of >= $100,000. Also shows records with property type of “Vacant Land” and gisacres of >= 10 and parval of >= $200,000. Any record with data in the 2+ removed field is excluded. Any record with a Date Mailed in the last x amount of days is excluded.
BRE Pricing by Zone Filter : Shows records which meet the following criteria. Property Type is either “Home” or “Home / Potentially Not Residential” (because we can’t always distinguish in some counties). Then each zone (1a through 6a) and the price filter for each respective zone. Any record with data in the 2+ removed field is excluded. Any record with a Date Mailed in the last x amount of days is excluded. This filter took a long time to create. Please don’t delete it!. You can modify this by changing any of the prices for each zone.
Combined Filter : Think of this as a combination filter. Shows all records which meet the criteria of any of the condo, vacant land, or Homes filter. Any record with data in the 2+ removed field is excluded. Any record with a Date Mailed in the last x amount of days is excluded.
Geography Filters
This is not the official name used by Mapsimise, but a name I made up. A “geographical filter” is any shape on the map used to filter the master list. There are many ways to make geographical filters. These filters are located (by default) about 2/3 of the way down the page, right above the layers and the data table. You can also double up filters. For example you can (and probably should) use a data filter and then a geographical filter on the data.
River Filters I have created 3 pre-existing river filters. These are meant to approximate the “homes on the river” list. It is not quite the same as the parcels that exactly touch the boundary of the rivers as in QGIS. The three river filters are the Watauga River Filter, South Fork New River Filter, North Fork New River Filter. Their buffers can be manipulated as you like.
KML Shape Filters I have pre-loaded many other shapes into the map. All the shapes have been uploaded as KML files and are readily available. First, at the top of the screen find “KMLs”. The current options are: Zone Shapes (ex: Zone1a), Watauga River, New River, High Elevations. The high elevations filter are all areas in the high county above 4000ft.
To use one of these as a data filter, from the “KMLs” list, click on one and it will pop up on the right side of the screen.
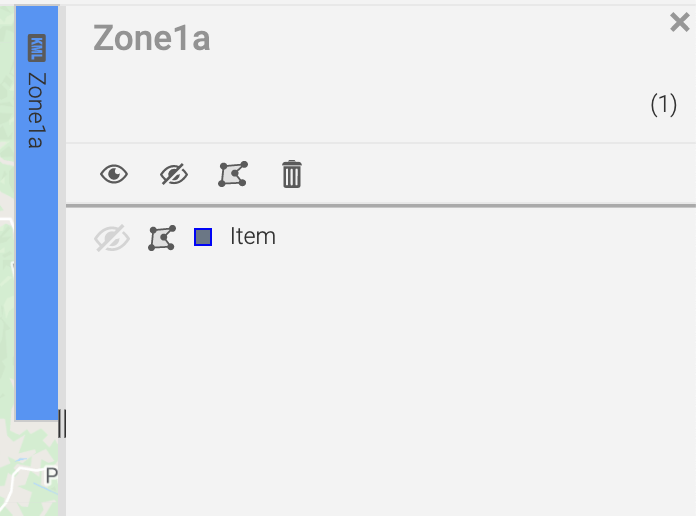
You can toggle the shape to be visible or not with the eye buttons. 
The polygon shape is used to make the object on the map a filter. 
You will see the shape come to life on the map. Your results will now be filtered to show just those inside the object. The filter will become an option in the filters bar, along with the river filters and others. These can all be renamed if you like.
Manual or Custom Filters
You can also make your own filters as you go.
Shape Filters At the top of the screen under “shape filters”, you can draw various shapes. Options include circle, rectangle, polygon, polyline, marker. These are pretty self explanatory. Draw these on the map and they will shop up with the rest of the filters.
Address Radius Filter I imagine you’ll be doing this regularly. This is for the scenario that you have an address for a just sold/just listed property and want to get the nearest 200 or so properties around it. In my opinion, this is the easiest way to do it.
In the menu bar of the map, click the magnifying glass
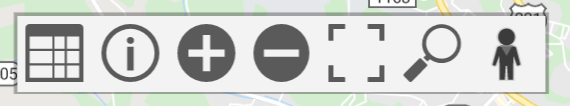
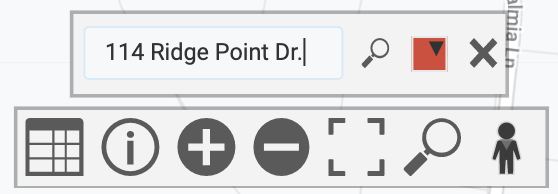
This search feature is the Google Maps search feature embedded into Mapsimise, and works the same way. You can type in a full address, place name, cross street, etc. and the map matches this as well as possible. In my opinion this is much easier and faster than filtering through the dataset for specific data.
Type in a place name as shown and you’ll zoom into that place:
There should be a point on the map at that address. Click the point and you’ll get the following popup:
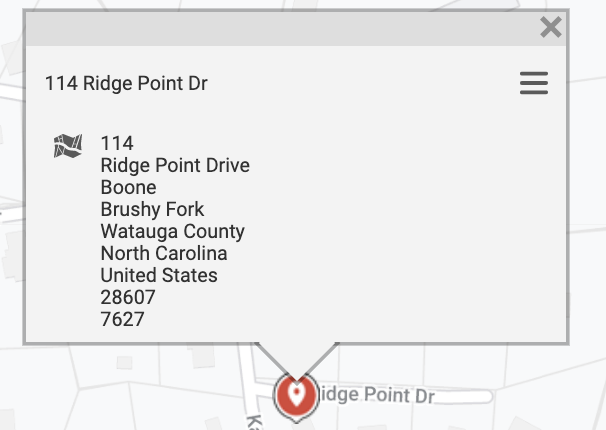
Click the three bars in the top right and “create filter”. Your filter will pop up in with the others and will be titled that place name by default. You can change the size, etc. just as you can with any other filter.